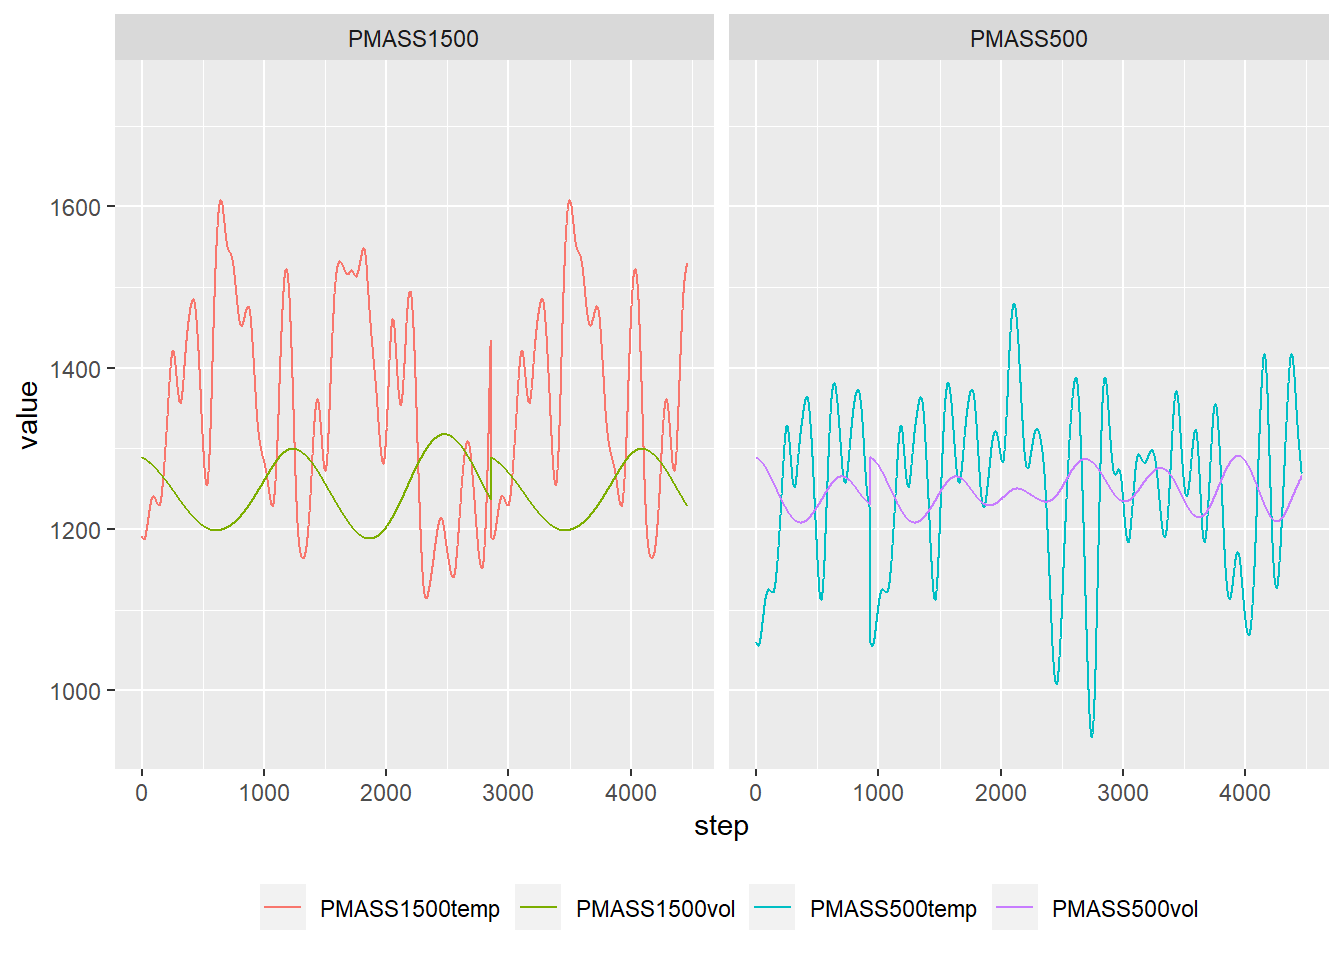
library(readxl)
library(tidyverse)
oscillations_raw <- read_excel("oscillations.xlsx", sheet = 3)


osc <- oscillations_raw


osc %>%
  pivot_longer(cols =colnames(osc)[2:5], names_to = "variable", values_to = "value") %>%
  mutate(group = case_when(str_detect(variable,"PMASS1500") ~ "PMASS1500",
                             TRUE ~ "PMASS500")) %>%
  ggplot(aes(step, value, colour = variable))+
  labs(colour = "")+
  facet_grid(~ group) +
  theme(legend.position = "bottom")+
  geom_line()