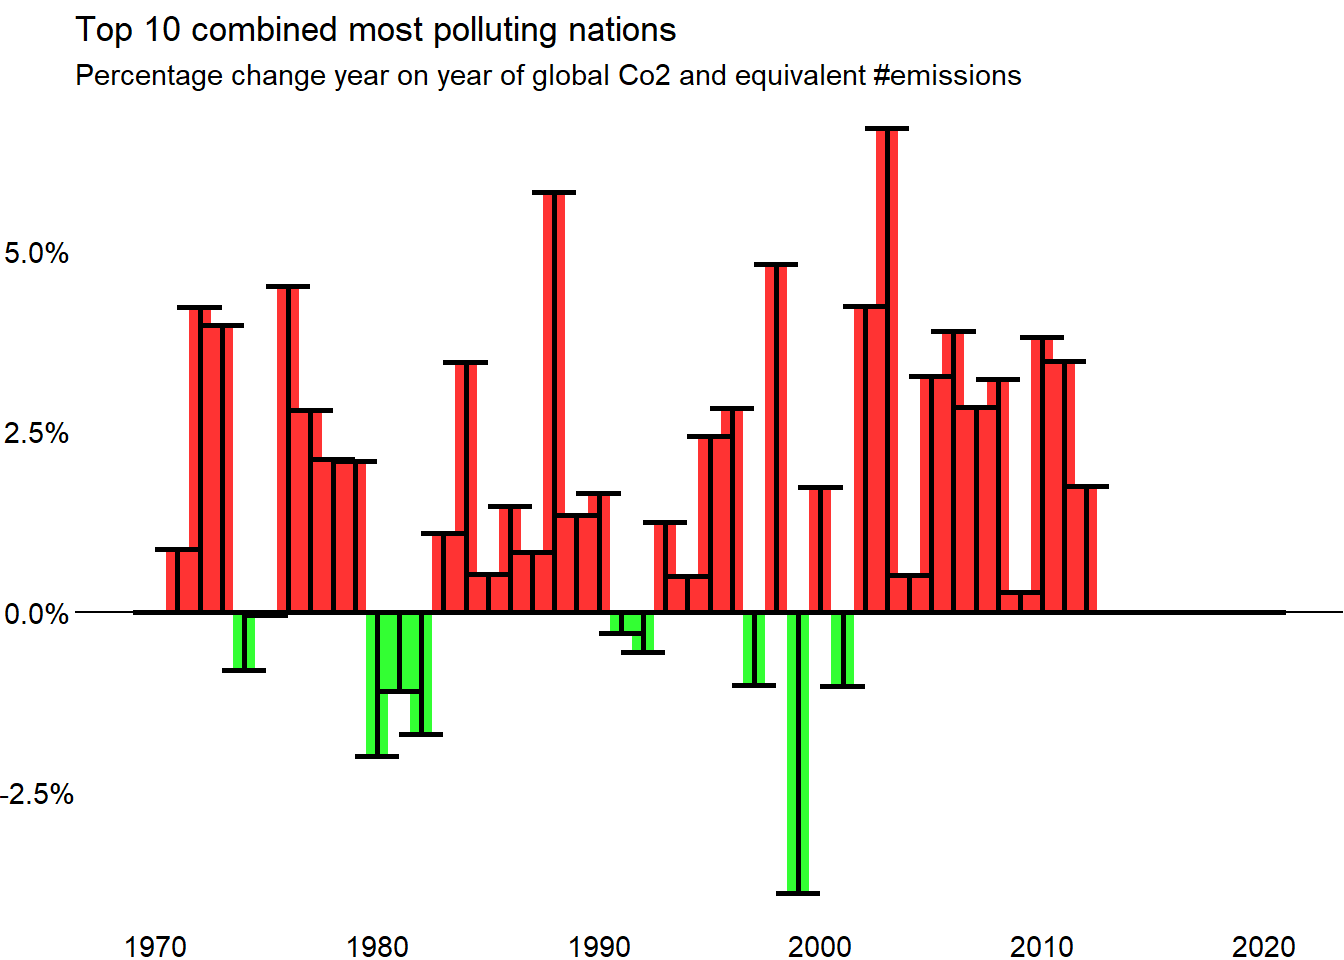
Climate change data
data sourced from the World Bank using WDI R package api.
library(Quandl)## Loading required package: xts## Warning: package 'xts' was built under R version 4.0.3## Loading required package: zoo## Warning: package 'zoo' was built under R version 4.0.4##
## Attaching package: 'zoo'## The following objects are masked from 'package:base':
##
## as.Date, as.Date.numericlibrary(wbstats)## Warning: package 'wbstats' was built under R version 4.0.3library(rWBclimate)
library(WDI)## Warning: package 'WDI' was built under R version 4.0.5library(tidyverse)## Warning: package 'tidyverse' was built under R version 4.0.5## -- Attaching packages ------------------------------------------------------------------------------- tidyverse 1.3.1 --## v ggplot2 3.3.3 v purrr 0.3.4
## v tibble 3.1.2 v dplyr 1.0.6
## v tidyr 1.1.3 v stringr 1.4.0
## v readr 1.4.0 v forcats 0.5.1## Warning: package 'ggplot2' was built under R version 4.0.3## Warning: package 'tibble' was built under R version 4.0.3## Warning: package 'tidyr' was built under R version 4.0.4## Warning: package 'readr' was built under R version 4.0.3## Warning: package 'dplyr' was built under R version 4.0.5## Warning: package 'forcats' was built under R version 4.0.3## -- Conflicts ---------------------------------------------------------------------------------- tidyverse_conflicts() --
## x dplyr::filter() masks stats::filter()
## x dplyr::first() masks xts::first()
## x dplyr::lag() masks stats::lag()
## x dplyr::last() masks xts::last()#WDIsearch("gdp")
#"EN.ATM.GHGT.KT.CE"
dat = WDI(indicator="EN.ATM.GHGT.KT.CE", country=c('CN','US','IN','RU','JP','GB','FR','DE'), start=1970)
gdp <- WDI(indicator = c("gdp_per_capita" = "NY.GDP.PCAP.KD",
"population" = "SP.POP.TOTL"))
dat %>%
ggplot(aes(year, EN.ATM.GHGT.KT.CE, color = country))+
geom_line()+
scale_y_log10(labels=scales::number_format())+
theme_void()+
labs(title = "CO2 and Equiv. emissions (Tonnes)",
y = "CO2 and Equiv. emissions")+
theme(axis.text.x = element_text(),axis.text.y = element_text(),legend.position = "bottom")## Warning: Removed 64 row(s) containing missing values (geom_path).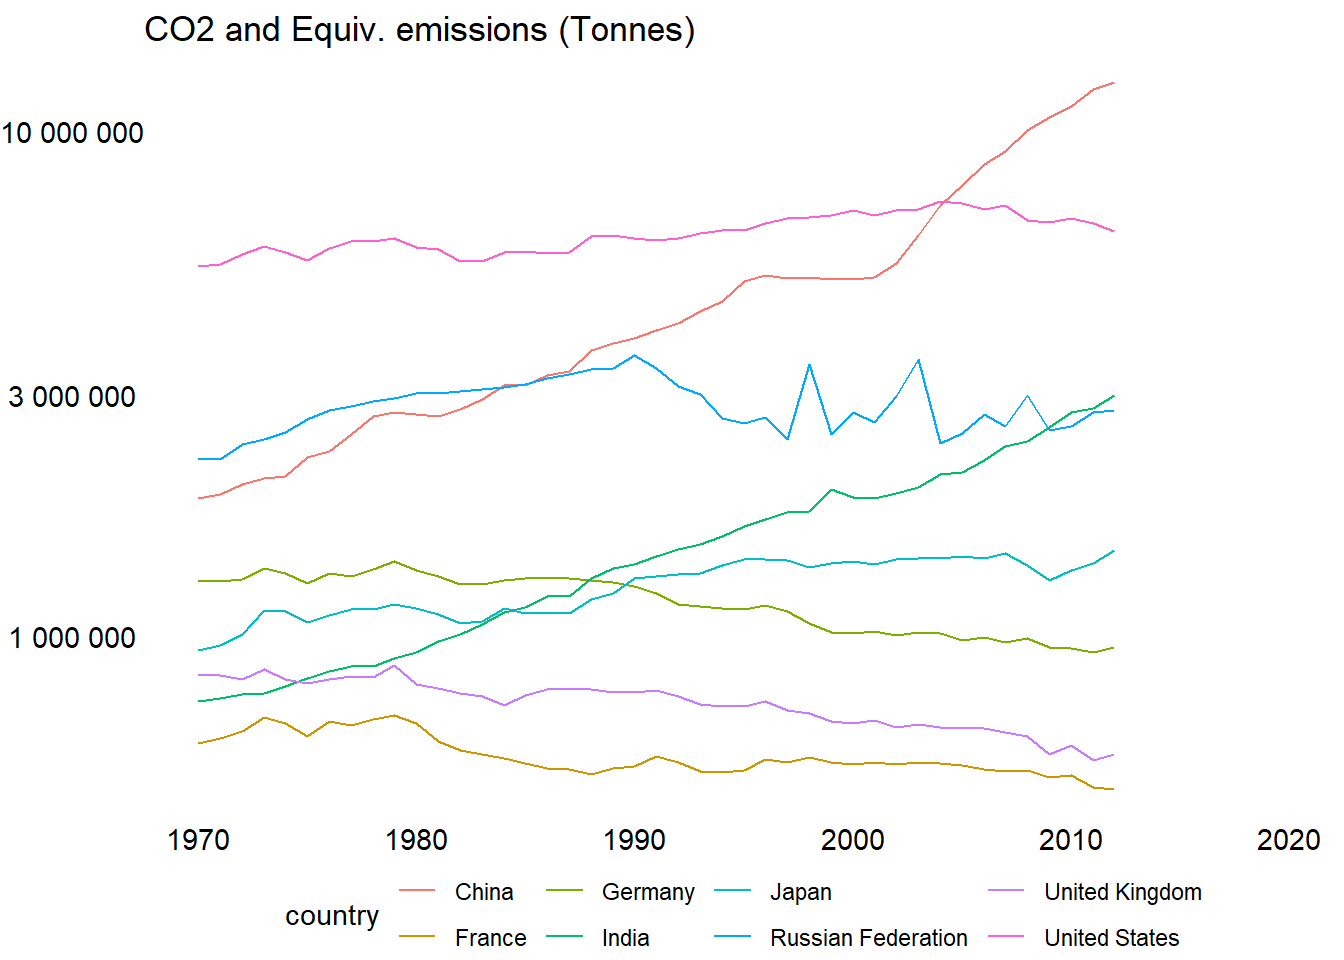
data <- dat %>%
  group_by(year) %>%
  summarise(total_emissions = sum(EN.ATM.GHGT.KT.CE)) %>%
  mutate(cumulative=cumsum(total_emissions))

data %>%
  mutate(perc_emissions = (total_emissions/lag(total_emissions)-1),
         state=ifelse(perc_emissions>0,"increasing","decreasing")) %>%
  ggplot(aes(year, perc_emissions))+
  geom_rect(aes(ymin=ifelse(state=="red",perc_emissions,0),xmin=year-0.5,xmax=year+0.5,fill=state,ymax=ifelse(state=="red",0,perc_emissions)),alpha=0.8)+
  scale_color_manual(values=c("green","red"),aesthetics = c("fill"))+
  geom_errorbar(aes(ymax=perc_emissions,ymin=0),lty=1,size=1,width=2)+
  geom_hline(yintercept = 0)+
  theme_void()+
  labs(title="Top 10 combined most polluting nations",
       subtitle="Percentage change year on year of global Co2 and equivalent #emissions")+
  theme(axis.text.x = element_text(),axis.text.y = element_text(),
        legend.position="none")+
  scale_y_continuous(labels=scales::percent_format())
## Warning: Removed 9 rows containing missing values (geom_rect).